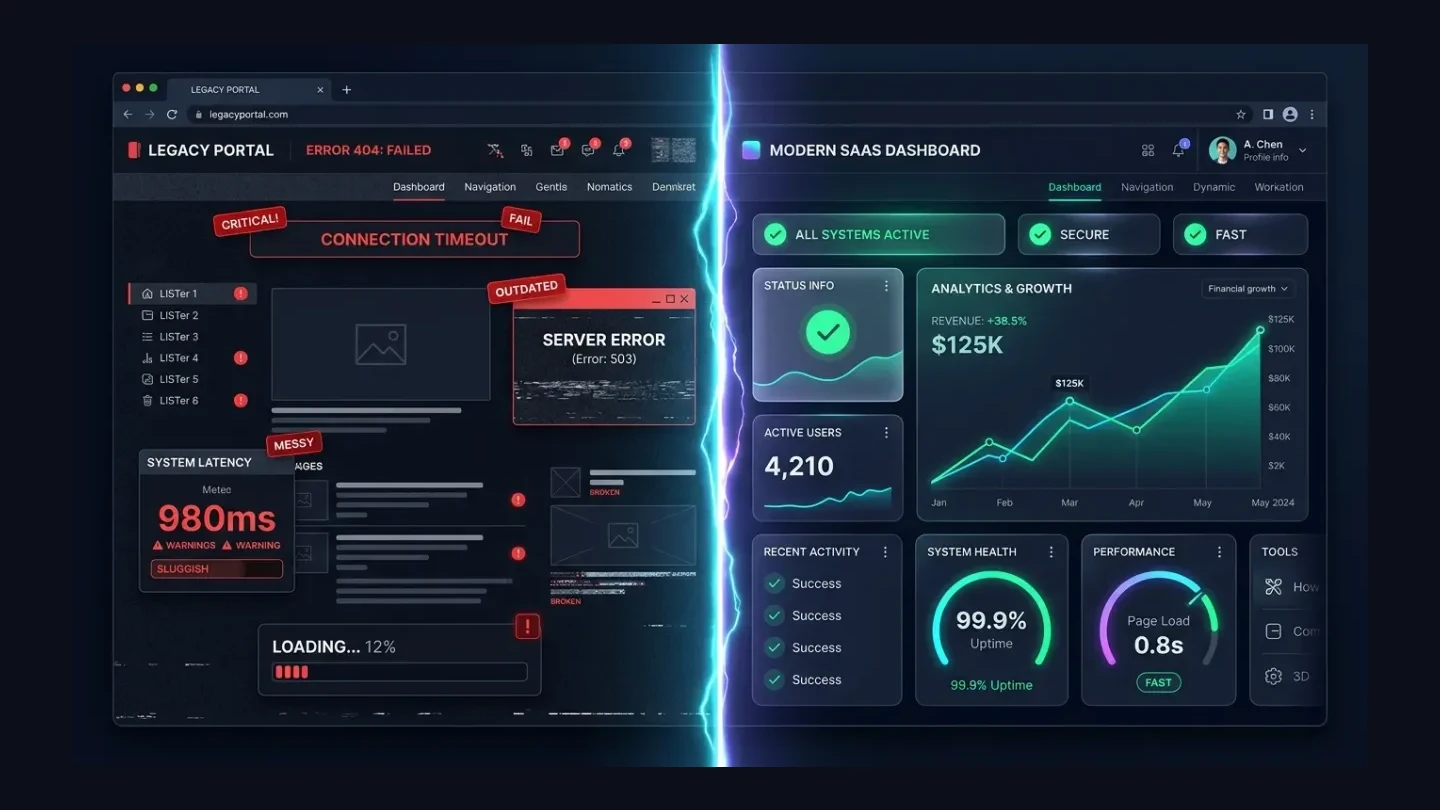
In digital commerce, patience is an extinct virtue. Whether you run a high-ticket B2B service agency, an export house selling across borders, or an e-commerce storefront, your prospective clients evaluate your operational competence within seconds of arriving at your domain.
If your web page hesitates, stalls, or loads in fragmented jerks, your visitors won't politely wait. They will click the back button and spend their money with your fastest competitor.
Extensive benchmark analytics from Google Search Console, Deloitte Digital, and Akamai confirm a brutal commercial reality: website speed is not a vanity technical metric—it is a direct financial lever.
Every single second of delay quietly siphons money out of your pipeline. Here is the mathematical reality behind web speed, how it dictates your bottom line, and the technical blueprint for achieving sub-second speed optimization.
The Math Behind Web Speed: The Cost of a 1-Second Delay
You could be spending thousands of dollars every month on Google Search Ads, LinkedIn campaigns, organic SEO, and email outreach. But if your landing pages take more than 3 seconds to render, you are pouring expensive traffic into a sieve.
Consider these verified industry benchmarks:
- Amazon's Speed Formula: Amazon calculated that just 100 milliseconds (0.1 second) of extra page load latency cost them 1% in total sales—which equates to billions in annual revenue.
- Walmart's Performance Findings: Walmart discovered that for every 1 second of speed improvement, their conversion rate jumped by 2%, with every 100ms decrease resulting in up to 1% incremental revenue.
- Akamai & Google Consumer Insights: A 1-second delay in mobile load times can decrease conversion rates by up to 20% on high-intent transactional landing pages, while increasing bounce rates by 32%.
Page Load Time vs. Conversion Decay Curve
| Total Page Load Time | Average Bounce Rate | Estimated Conversion Decay | Revenue Impact on $50k/mo Revenue |
|---|---|---|---|
| 0.5s – 1.2s (Optimal) | < 18% | Baseline (Peak Performance) | 100% Capture ($50,000) |
| 2.0s – 2.9s (Average) | 35% | - 10% to - 15% | Leaking $5,000 - $7,500/mo |
| 3.5s – 4.5s (Sluggish) | 53% | - 25% to - 35% | Leaking $12,500 - $17,500/mo |
| 6.0s+ (Critical) | > 75% | - 50% to - 70% | Leaking $25,000+/mo |
🚨 The Reality: When your website is slow, you don't just lose current traffic—you permanently drive up your Customer Acquisition Cost (CAC) because half of the clicks you paid for never even saw your headline.
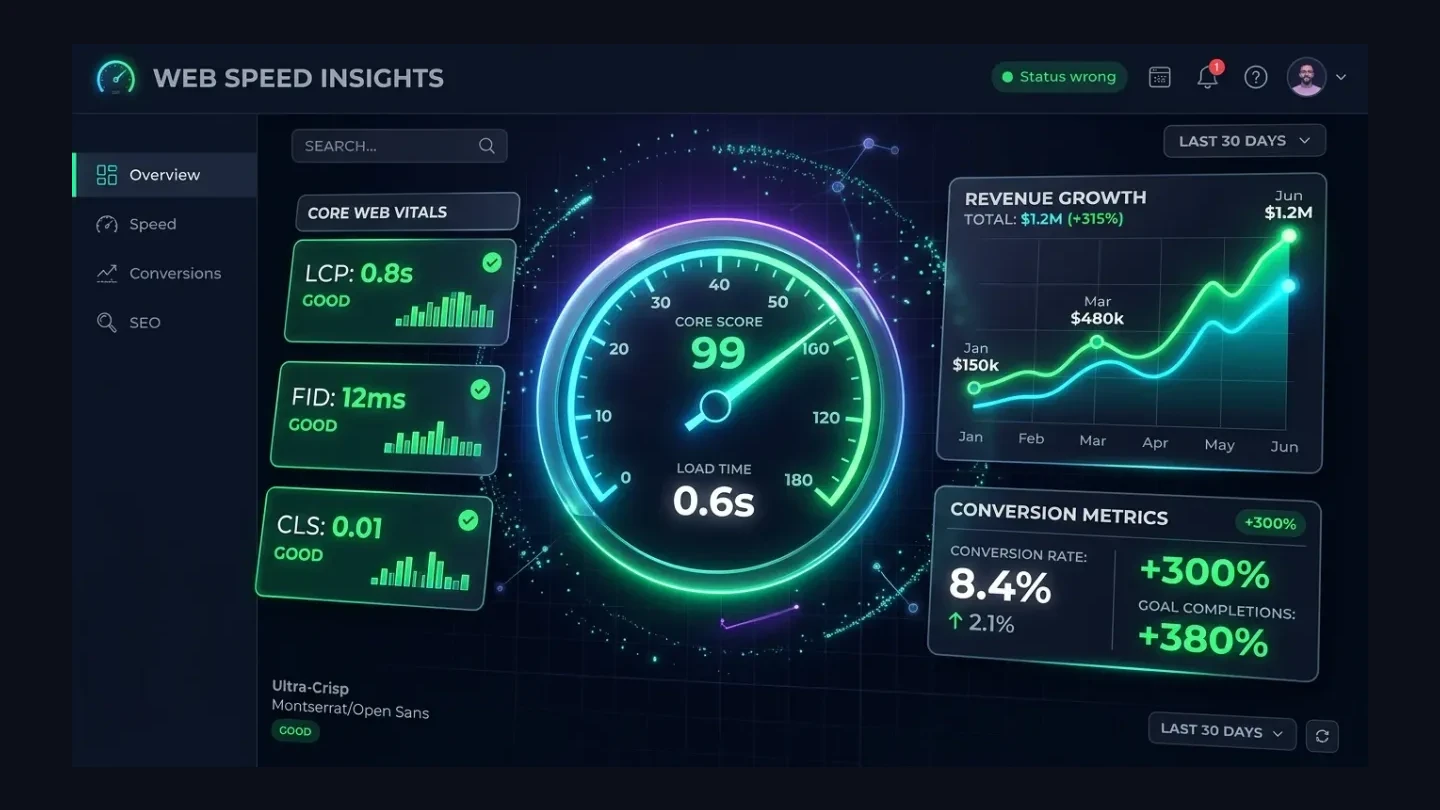
How Google Evaluates Speed: Core Web Vitals Breakdown
Google no longer ranks websites based solely on keyword density or backlinks. With the rollout of the Core Web Vitals page experience update, technical performance is an official organic ranking factor.
If your site fails Core Web Vitals, Google deprioritizes your URLs in favor of competitors who deliver clean, frictionless browsing.
[The 3 Pillars of Google Core Web Vitals]
├── 1. LCP (Largest Contentful Paint) ➔ Perceived Speed (When does main content show?)
├── 2. INP (Interaction to Next Paint) ➔ Responsiveness (How fast does UI react to clicks?)
└── 3. CLS (Cumulative Layout Shift)  ➔ Visual Stability (Does the page jump around?)
1. Largest Contentful Paint (LCP)
- What it measures: The exact time it takes for the largest visual block above the fold (usually your hero headline or banner image) to render completely.
- Google's Benchmark: Under 2.5 seconds is "Good". Anything over 4.0 seconds is classified as "Poor".
- Our Target at Joy Digital: Under 1.0 second.
2. Interaction to Next Paint (INP)
- What it measures: The delay between a user clicking a button, opening a mobile navigation drawer, or typing into an input field, and the browser visually updating the screen.
- Google's Benchmark: Under 200 milliseconds is "Good".
- The Culprit: Heavy JavaScript execution threads that freeze the browser's main thread.
3. Cumulative Layout Shift (CLS)
- What it measures: Visual layout stability. Have you ever tried to tap a button on your phone, only for a late-loading advertisement or banner to push the button down, causing you to misclick? That is layout shift.
- Google's Benchmark: CLS score must stay below 0.1.
Need a Website That Converts Visitors into Direct Paying Clients?
Most websites fail to generate sales because they are slow and lack conversion funnels. Joy Digital builds custom, sub-second Next.js web applications with 95+ PageSpeed, built-in SEO, and frictionless 1-click WhatsApp lead captures.
The Top 4 Reasons Most Business Websites Are Lagging
When we perform a technical SEO audit on client websites, we routinely uncover four recurring structural bottlenecks:
1. Massive, Uncompressed Media Files
Business owners frequently upload 5MB to 8MB uncompressed PNG or JPG photos taken directly from cameras or stock photo sites. Serving a multi-megabyte image over a mobile connection immediately stalls rendering for 4 to 6 seconds.
2. Monolithic CMS & "Plugin Paralysis"
Traditional platforms like WordPress require third-party plugins for every minor feature: SEO, forms, analytics, security, social feeds, and caching. When a user requests a single page, the server must query the MySQL database dozens of times and execute thousands of lines of PHP code before sending a single byte of HTML.
3. Third-Party Script Congestion
Chat widgets, heatmaps, multiple tag managers, tracking pixels (Meta, LinkedIn, Google Tag Manager, TikTok), and font loaders all compete for network bandwidth. Without script prioritization, these third-party trackers block the browser from showing your actual product.
4. Cheap Shared Hosting Without Edge Caching
Running a commercial enterprise on a $4/month shared hosting server means your site is sharing CPU and RAM with thousands of unrelated websites. During peak traffic hours, Time to First Byte (TTFB) spikes from 200ms to over 2,000ms.
The Joy Digital Approach: Engineering Sub-Second Page Performance
At Joy Digital, we don't apply superficial speed band-aids like minifying a couple of CSS files or installing another caching plugin. We re-engineer web platforms from the ground up using modern, high-performance architecture:
[Traditional CMS Pipeline]
Browser Request ➔ Origin Web Server ➔ Heavy Database Queries ➔ Monolithic HTML Assembly (3.5s - 5s)

[Joy Digital Next.js Edge Architecture]
Browser Request ➔ Distributed Edge CDN Node ➔ Instant Pre-rendered Static/SSR Cache (0.4s - 0.8s)
1. Hybrid Server-Side Rendering (SSR) & Static Site Generation (SSG)
Using Next.js web development, our websites generate clean HTML ahead of time or on high-speed serverless edges. Visitors receive a fully rendered page in milliseconds without waiting for heavy client-side JavaScript execution.
2. Automatic AVIF & WebP Asset Pipelines
We implement intelligent image pipelines that automatically convert imagery into modern AVIF and WebP formats, sizing assets dynamically to the exact resolution of the visitor's screen. A 4MB hero banner shrinks to 45KB with zero perceptible loss in visual clarity.
3. Distributed Edge Caching (Global CDN)
Whether your client is loading your website from Chennai, New York, London, or Dubai, our edge infrastructure serves the page from a data center located just miles from their physical device, reducing latency to near zero.
4. Zero Render-Blocking Bloat
We audit and streamline script delivery. Critical CSS is inlined above the fold, while tracking analytics and non-essential scripts are deferred or offloaded to web workers, keeping the main browser thread silky smooth.
Case in Point: What Happens When Speed Improves?
Upgrading an underperforming B2B industrial website from a legacy template build to a custom Next.js architecture produced the following metrics within 60 days:
- Page Load Speed: Dropped from 4.8 seconds to 0.7 seconds (an 85% speed improvement).
- Mobile PageSpeed Score: Jumped from 34/100 to 98/100.
- Organic Search Impressions: Increased by 68% following the recovery of Core Web Vitals status.
- Form Conversion Rate: Increased from 1.4% to 3.8%, more than doubling the client's monthly qualified inquiries without spending an extra rupee on paid ads.
How Fast Is Your Website Right Now?
Don't guess where your website stands. Test your domain on Google PageSpeed Insights or GTmetrix.
If your mobile score is below 85, or if your pages take longer than 2 seconds to load, your business is losing money every single hour.
Get Your Free Speed & Conversion Audit Today
Let the engineering team at Joy Digital inspect your web infrastructure. We will provide an in-depth, diagnostic report highlighting your exact server bottlenecks, uncompressed assets, script conflicts, and actionable steps to achieve sub-second speeds.
👉 Claim Your Free Website Speed & Conversion Audit Report – No obligations, no pushy sales tactics—just clear, actionable engineering data. Or contact our development specialists to discuss building your high-speed custom platform today!
Recommended Services & Solutions
Frequently Asked Questions

Digital marketing strategist and Next.js web developer focusing on search optimization, Core Web Vitals, and B2B conversion rate growth.